Casual Inference Data analysis and other apocrypha
What customer group drove the change in my favorite metric? Exact decompositions of change over time
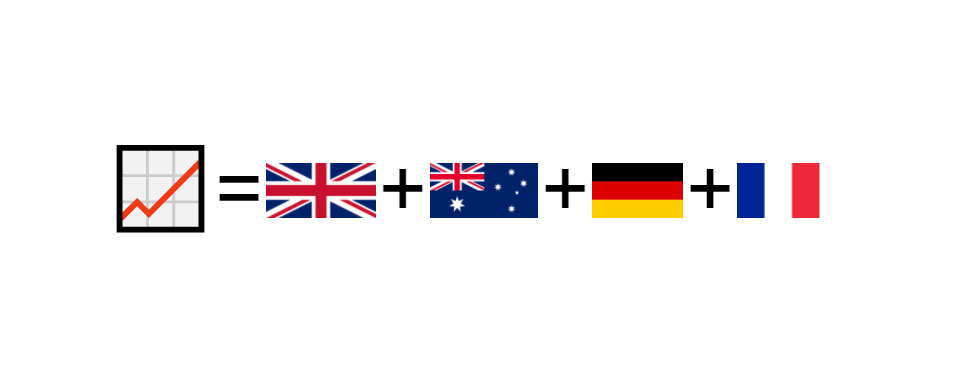
As analytics professionals, we frequently summarize the state of the business with metrics that measure some aspect of its performance. We check these metrics every day, week, or month, and try to understand what changed them. Often we inspect a few familiar subgroups (maybe your customer regions, or demographics) to understand how much each gro... Read more 03 Mar 2021 - 12 minute read
Partial dependence plots are a simple way to make black-box models easy to understand

A commonly cited drawback of black-box Machine Learning or nonparametric models is that they’re hard to interpret. Sometimes, analysts are even willing to use a model that fits the data poorly because the model is easy to interpret. However, we can often produce clear interpretations of complex models by constructing Partial Dependence Plots. Th... Read more 27 Nov 2020 - 24 minute read
Would collecting more data improve my model's predictions? The learning curve and the value of incremental samples

Since we usually need to pay for data (either with money to buy it or effort to collect it), it’s worth knowing the value of getting more data points to fit your predictive model. We’ll explore the learning curve, a model-agnostic way of understanding how performance changes as we add more data points to our sample. Analysis of the learning curv... Read more 04 Oct 2020 - 8 minute read
Understanding the difference between prediction and confidence intervals for linear models in Python

The difference between prediction and confidence intervals is often confusing to newcomers, as the distinction between them is often described in statistics jargon that’s hard to follow intuitively. This is unfortunate, because they are useful concepts, and worth exploring for practitioners, even those who don’t much care for statistics jargon. ... Read more 26 Sep 2020 - 14 minute read
When do we log transform the response variable? Model assumptions, multiplicative combinations and log-linear models
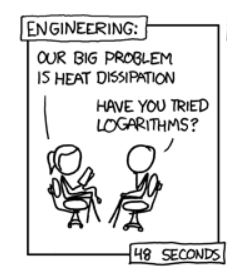
Sometimes, analysts will perform a log transformation of the outcome variable to “make the residuals look normal”. In some cases this is just papering over other issues, but sometimes this kind of transformation genuinely improves the inference or produces a better fitting model. In what cases does this happen? Why does the log transformation wo... Read more 30 Aug 2020 - 11 minute read