Casual Inference Data analysis and other apocrypha
How did my treatment affect the distribution of my outcomes? A/B testing with quantiles and their confidence intervals in Python

We’re familiar with A/B tests that tell us how our metric (usually an average of some kind) changed due to the treatment. But if we want to get a better than average insight into the treatment effect, we should look beyond the mean. This post demonstrates why and how we might look at the way the quantiles of the distribution changed as a result ... Read more 11 Jun 2022 - 14 minute read
Symbolic Calculus in Python: Simple Samples of Sympy

My job seems to involve just enough calculus that I can’t afford to forget it, but little enough that I always feel rusty when I need to do it. In those cases, I’m thankful to be able to check my work and make it reproducible with Sympy, a symbolic mathematics library in Python. Here are two examples of recent places I’ve used Sympy to do calcul... Read more 04 Aug 2021 - 7 minute read
Describing and Forecasting time series: Autoregressive models in Python
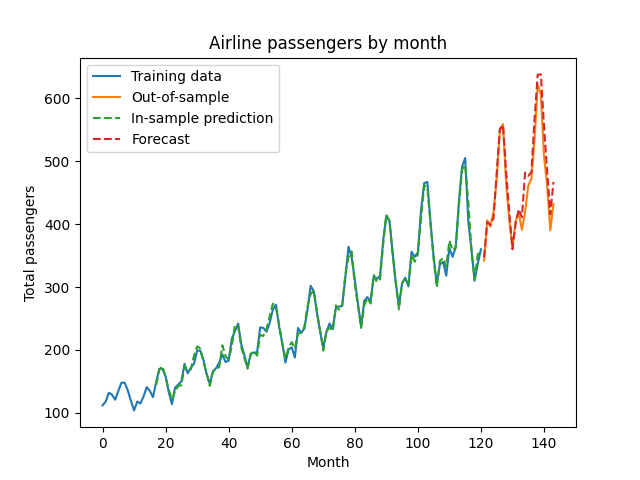
Plenty of problems confronted by practicing data scientists have a time series component. Luckily, building time series models for forecasting and description is easy in statsmodels. We’ll walk through a forecasting problem using an autoregressive model with covariates (AR-X) model in Python. Time series data is everywhere For practicing data ... Read more 21 Jul 2021 - 10 minute read
Machine learning models for decision making in Python: Picking thresholds for asymmetric payoffs

Machine learning practitioners spend a lot of time thinking about whether their model makes good predictions, usually in the form of checking calibration, accuracy, ROC-AUC, precision or recall. But for ML to add value, its predictions need to be harnessed for decision making, not just prediction. We’ll walk through how you can use probabilistic... Read more 10 Jul 2021 - 12 minute read
What customer group drove the change in my favorite metric? Exact decompositions of change over time

As analytics professionals, we frequently summarize the state of the business with metrics that measure some aspect of its performance. We check these metrics every day, week, or month, and try to understand what changed them. Often we inspect a few familiar subgroups (maybe your customer regions, or demographics) to understand how much each gro... Read more 03 Mar 2021 - 12 minute read