Casual Inference Data analysis and other apocrypha
Practical poisson

Count data is everywhere (“Commonality of counting”)
We are constantly counting stuff, and collecting data about counts of things that are happening. Some examples that come to mind easily for practicing data analysts:
- Customers showing up on a website
- Leads landing in a sales system
- Transactions being generated on ecommerce website
- Raw material showing up to be refined or used in production
- Counts of errors occurring in a system
We care about these counts - are they going up? Are they going down? Did we get more when we tried some new method? Is there a change from last time to this time? Usually, they form the first step in a funnel or production process, and our final output is partly a function of how many inputs we get.
More practically speaking, there are a bunch of handy statistical tools that we can use when we’re counting things. Those tools make it easy to calculate standard errors and CIs when we only know the count of something. Those measures of uncertainty will help us separate signal from noise, and make better decisions as we think about those counting processes.
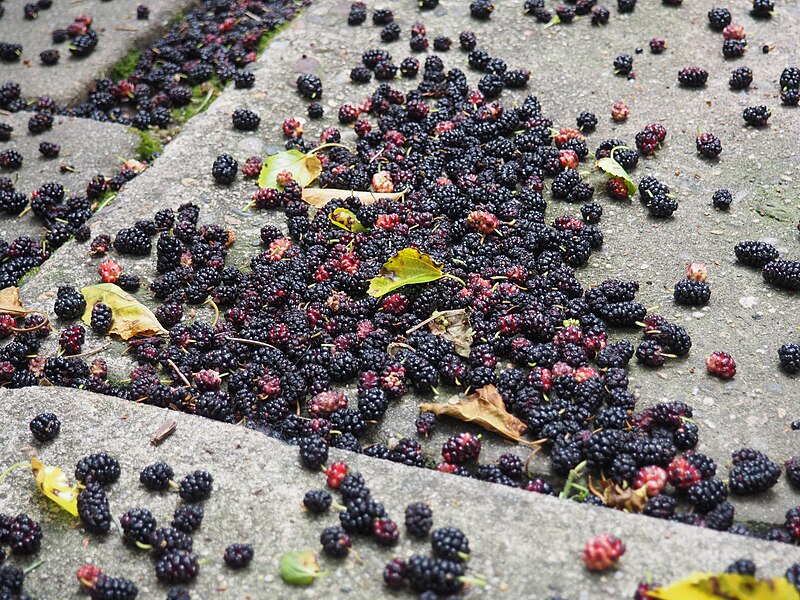
Let me provide a more colorful example (a purple one, it will turn out). So, I recently found out that my backyard has a very productive berry tree. I know sadly little about berries (I thought they only grew on bushes!?), but after some Googling I discovered that my new neighbor was a mulberry tree. Mulberries, it turns out, are edible and quite tasty! Since I had to clean them up anyway, I collected them and started turning them into jam and wine (jam is a success so far; wine is a work in progress).
Let’s ask a practical question now. It rained very hard today yesterday but not today - is there a statistically significant difference in the arrival count between the two days? This case study is tiny data; literally two numbers. However, if we’re willing to make certain assumptions, it will turn out we can answer this question.
Count data and the Poisson process
We talked about processes that produce “count data”, just now. How do we recognize one of those in the wild? The kind of data we’re going to talk about in this conversation has the following features:
- We’re counting discrete items (think of distinct items on a conveyor belt, rather than a flow of liquid). In our example above, the berries are discrete, and we won’t consider fractions of a berry.
- The items arrive over a fixed period. In this example, it’s a day, the time between berry collection. There’s some average number of arrivals per period, which we’ll call $\lambda$. More specifically, we’ll assume that the number of arrivals per period has a $Poisson(\lambda)$ distribution, and each is independent. I could try to falsify this assumption by collecting berries for a few periods, and seeing whether the resulting data resembles a poisson distribution.
- The time between arrivals has an exponential distribution. I could verify this assumption by standing outside with a stopwatch and counting how much time passes in the inter-berry windows, then comparing to an exponential distribution (and it can often be verified in non-berry scenarios by looking at user data from your data warehouse).
If we are comfortable making these assumptions based on our understanding of the process and the data we have at hand, then we are dealing with a Poisson process. There is a snarly bit of vocabulary here, as the Poisson process and Poisson distribution are different (but closely related). This SO post helped me understand it. Roughly, the way to differentiate this is that the entire setup of discrete berries arriving is a Poisson process, and in Poisson Process the arrival counts have a Poisson distribution. For the rest of this post, we’ll mostly talk about the Poisson distribution and how to deal with it.
Although berry-gathering is a slightly whimsical example, processes like this are all over the place, and organizations often need to think about that. A real-life (though perhaps still whimsical) example comes from an analysis done by Ladislaus Bortkiewicz for the Prussian army in the 19th century. Bortkiewicz modeled the number of Prussian soldiers killed annually by horse kick (!) as a Poisson distribution.
The relationship between the expontial distribution and Poisson distributions is not immediately obvious to me, but I found this SO thread to have useful explanations.
important feature of the poisson distribution: mean = variance. how could we show this from real data? one possibility: look at time blocks next to each other. Is the average mean - average variance zero?
model of the treatment effect
CIs and SEs of the rate
poisson-gamma
Demo of poisson-gamma distribution with “flat” prior. Note coverage is good with a single sample unless rate is near one
from scipy.stats import gamma, poisson
import numpy as np


n_sim = 1000

n_sample_size = 1

test_rates = [0.5, 1, 2, 3, 4, 5, 10]

coverage_rates = []

for true_rate in test_rates:
    correct_coverage = 0
    a,b = .00001, .00001

    for _ in range(n_sim):
        data = poisson(true_rate).rvs(n_sample_size)
        low, high = gamma(a + np.sum(data), scale = 1./(b + len(data))).interval(.95)
        if low < true_rate < high:
            correct_coverage += 1

    coverage_rates.append(correct_coverage / n_sim)

plt.plot(test_rates, coverage_rates, marker='o')`
posterior predictive: example, planning for how many berries I might get over the next week
Also, a normal estimate
compare also: Normal-based estimate
https://stats.stackexchange.com/questions/401754/determining-confidence-interval-with-one-observation-for-poisson-distribution
going from here
what if it’s not poisson? negative binomial, https://en.wikipedia.org/wiki/Overdispersion
afterwards: Rates based on binomial, or perhaps a more interesting function. convert raw product into other discrete products (Binomial) or yield base on average per unit.
conditional means: poisson regression
maybe there’s a random walk structure to \lambda; there’s probably some way of modeling that
Written on th, by Louis Cialdella